Did the total solar eclipse impact the weather?

If you were in the path of the total solar eclipse last week, you may have observed a change in your environment. The more sunlight that was blocked, the more dramatic the changes.

Skiers and hikers take in the view from the Appalachian Trail at the summit of Saddleback Mountain during the total solar eclipse last Monday, near Rangeley, Maine. (Photo credit: Robert F. Bukaty, Associated Press)

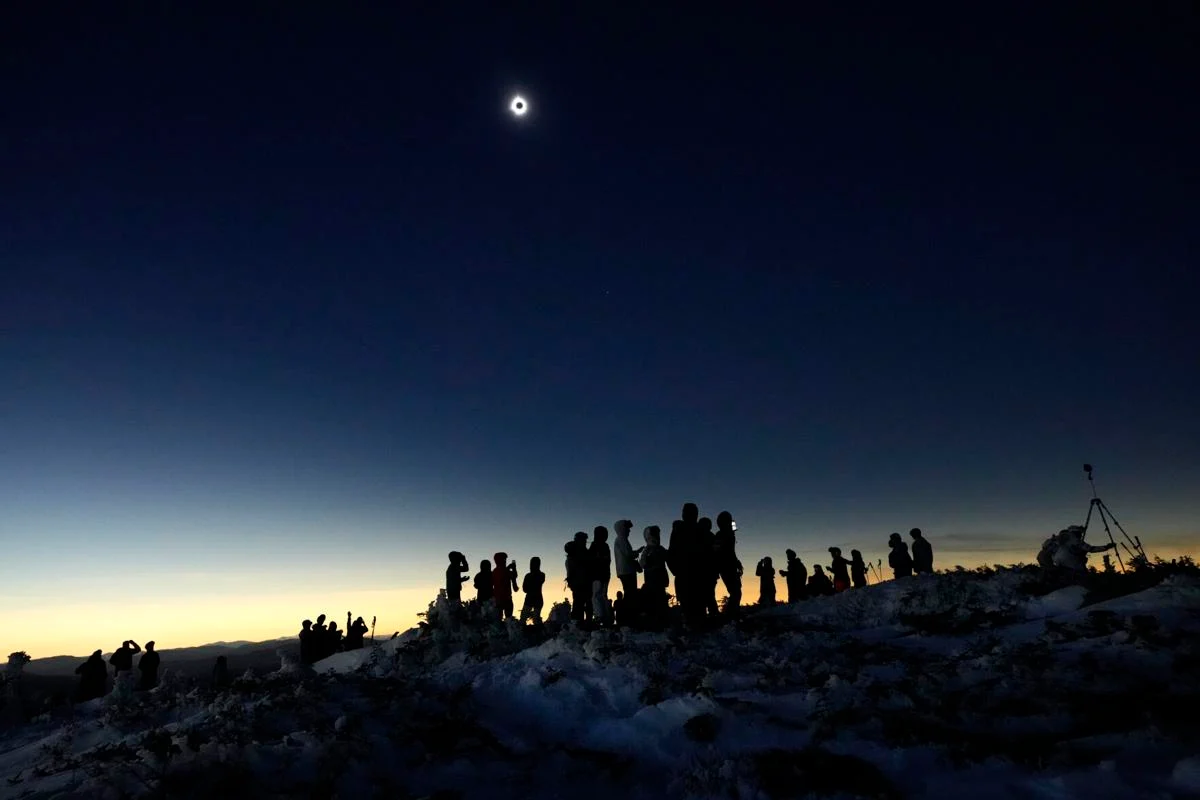
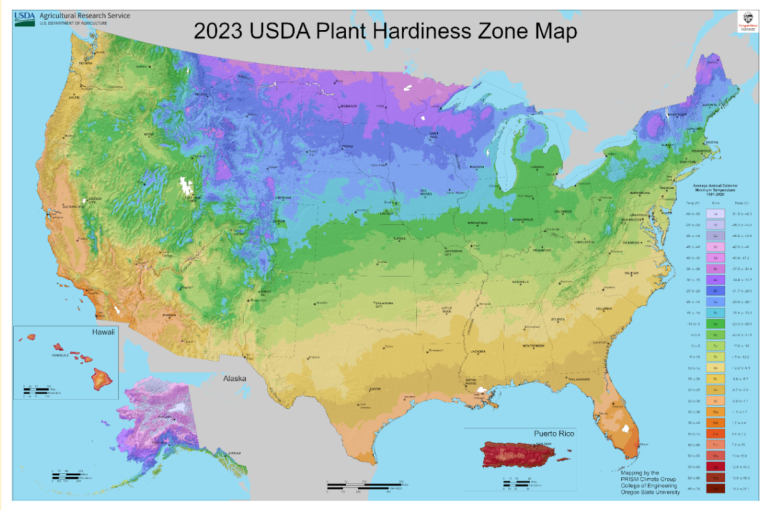
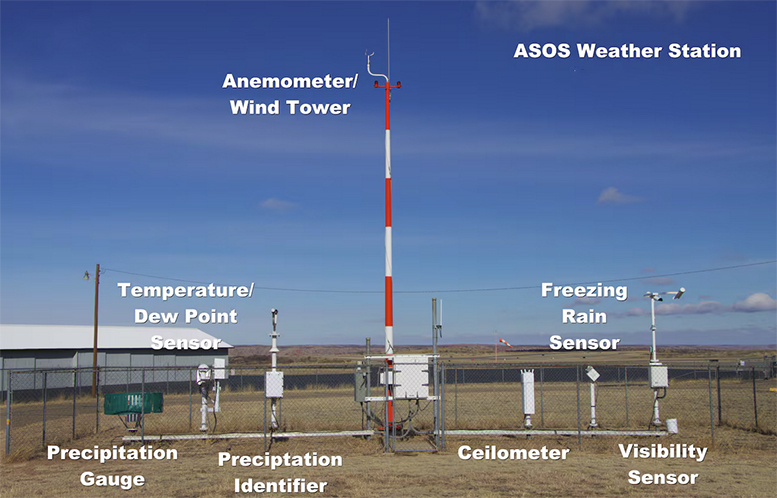
A range of surface and near-surface meteorological observations can occur during a total solar eclipse. If it was a cloud-free day, or mostly cloudy day, you probably felt a drop in temperature. As the moon crossed in front of sun, it cast a shadow blocking solar energy from reaching your location. While it may have lasted only a few minutes, the reduction in solar radiation would result in a drop in temperature. In some locations, the temperature dropped by as much as 10 degrees. As the sun reappeared, the temperature increased.

A drop in temperature would include a corresponding increase in the relative humidity. So, it might have felt more humid. You may have also observed a change in the wind speed.

The planetary boundary layer, also referred to as the atmospheric boundary layer, is the lowest part of our atmosphere. It is about 0.6 miles thick and is where the atmosphere exchanges energy directly with the ground. The exchanges are primarily mechanical (e.g. wind and turbulence) and thermal. The thermal contact between the boundary layer and the ground surface is a result of the amount of solar radiation.

You may have already observed, in the absence of a storm, that after sundown the wind calms. When the sun sets, the radiative cooling of the ground increases the stability of the lower atmosphere. This reduces the energy exchanges between the atmosphere and the surface. This can result in the wind dying down. The drop in temperature you experienced during the eclipse would similarly cool the ground.

Steve Ackerman and Jonathan Martin, professors in the UW-Madison department of atmospheric and oceanic sciences, are guests on WHA radio (970 AM) at 11:45 a.m. the last Monday of each month. Send them your questions at stevea@ssec.wisc.edu or jemarti1@wisc.edu.

Category: Meteorology, Phenomena

Comments Off on Did the total solar eclipse impact the weather?

What are good weather apps for smart phones?

Good weather apps for smart phones provide easy access to current weather and forecasts. Many apps tell you about the high temperature for the day and can provide an hour-by-hour breakdown of temperatures, chance and type of precipitation, air quality and other weather information.

Your device likely comes with an installed weather app, but consider exploring other apps. Apps that include live weather radar and any severe weather alerts for your area are valuable. They are useful for identifying precipitation and storm location and movement. Many include lightning flash locaters, too. Apps with current weather radar data provide useful information when you need to be outside and precipitation is in the area.

Weather apps are pulling data that is freely provided by National Oceanic and Atmospheric Administration The NOAA and National Weather Service provide weather observations, output from numerical weather prediction models and professional analysis thereof. Weather apps translate this data into easily accessible information using a sunny icon, a rainy cloud, or a lightning flash. Some also include analysis and interpretation of the NWS data by their own meteorologists.

There are apps that allow you to upload your precipitation observations, such as mPING and CoCoRaHS. This data is then visible to others for their use.

As professional meteorologists, we have access to weather information from various resources. However, we also have weather apps on our phones. Apps that include wireless emergency alerts that are activated during severe weather are particularly valuable.

A potential downside to some free apps is that they include ads that can be distracting. Some apps may collect, use, and share your data. That is why it’s important to understand their privacy policies, too.

Steve Ackerman and Jonathan Martin, professors in the UW-Madison department of atmospheric and oceanic sciences, are guests on WHA radio (970 AM) at 11:45 a.m. the last Monday of each month. Send them your questions at stevea@ssec.wisc.edu or jemarti1@wisc.edu.

Category: Meteorology, Uncategorized

Comments Off on What are good weather apps for smart phones?

What does a percent chance of rain mean?

Most of us understand the meaning of a high and low temperature forecast. More confusing is the meaning of a “chance of rain” expressed as a percentage in a weather forecast.

The National Weather Service calculates a probability of precipitation, or PoP. The PoP describes how likely it is for a measurable amount of rain (at least 0.01 inches) to occur in a given time in the forecast area.

The PoP is calculated by multiplying two factors — the forecast’s certainty that rain will fall in the area and how widespread it is expected to be. As an example, if the NWS issues a forecast that is 100% sure that rain will occur but that it will only cover 60% of the forecast area, the forecast is for a 60% chance of rain (PoP = 1 x 0.6 x 100%).

Several studies have demonstrated that expressing the precipitation forecast as a single-event probability leads to confusion. Another way to think of a forecast of 40% chance of rain tomorrow: If there are 10 days in which the atmospheric conditions were exactly like today, in four out of those 10 cases there will be at least a minimum amount of rain the next day.

Predicting weather is an age-old problem, and an important one to our lives. Many of us have smartphones and use weather apps to help plan our outdoor activities. These apps include chances of precipitation, and we may devise personal ways to interpret this prediction based on our experience, thinking of it as the likelihood of precipitation occurring. We probably interpret a PoP of less than 20% as good for outdoor activity while a PoP of more than 70% probably suggests planning for rain.

Steve Ackerman and Jonathan Martin, professors in the UW-Madison department of atmospheric and oceanic sciences, are guests on WHA radio (970 AM) at 11:45 a.m. the last Monday of each month. Send them your questions at stevea@ssec.wisc.edu or jemarti1@wisc.edu.

Category: Uncategorized

Comments Off on What does a percent chance of rain mean?

Has our plant hardiness zone changed?

This new Plant Hardiness Zone Map was generated from the past three decades of data reflecting overall warming, especially in overnight lows. The data mostly comes from weather stations and reveals a general trend of warmer temperatures, as zones tending to be farther north in the 2023 map. (Image credit: USDA)

If you are involved with gardening, you probably are aware of the Plant Hardiness Zone Map, or PHZM, often listed on seed packets. The U.S. Department of Agriculture developed the zones and first published them in 1960. The USDA updated them in 2012 and more recently in November 2023.

A hardiness zone provides information on the type of plants capable of surviving certain climatic conditions. The designations are based on the “average annual extreme minimum temperature” at a given location during a particular 30-year period. The climate zones are determined from temperature records kept by National Atmospheric and Oceanic Administration.

Every 10 years NOAA computes a revised 30-year average temperature and extreme temperatures for the U.S. using climate observations collected at local weather stations across the country. The newest revision spans the 30-year period from 1991 to 2020. The influence of long-term global warming is reflected in the revised temperatures. The 30-year average minimum winter temperatures increased at nearly all locations in the continental U.S.

The revised PHZM reflects this climate change. Compared with the 2012 map, the 2023 designation shows that about half of the country shifted to the next warmer half zone, and the other half of the country remained in the same half zone. Previously, northwestern Wisconsin was in zones 4a and 3b; the revised map indicates the region to be zone 4a. The colder zone of 3b is no longer a designation in Wisconsin.

While the hardiness zones are very useful, they cannot account for all climate and weather conditions such as snowfall, which can insulate the plants during a cold winter, or severe summertime heat. In addition to knowing your plant hardiness zone, it is also very useful to talk with local master gardeners and nurseries as you plan your plantings this season.

Steve Ackerman and Jonathan Martin, professors in the UW-Madison department of atmospheric and oceanic sciences, are guests on WHA radio (970 AM) at 11:45 a.m. the last Monday of each month. Send them your questions at stevea@ssec.wisc.edu or jemarti1@wisc.edu.

Category: Climate, Seasons

Comments Off on Has our plant hardiness zone changed?

How is visibility distance evaluated for a weather map?

The weather observing stations of the National Weather Service operate in fully automatic mode and have sensors that measure visibility.

National Weather Service (NWS) Automated Surface Observing System (ASOS). (Photo credit: NOAA/NWS)

These instruments sense the forward scattering characteristics of light to measure the extinction coefficient of a high intensity beam directed at a volume of air close to the sensor. This provides an accurate measurement over a range of visibilities. The use of light within the visible spectrum also allows the sensor to simulate human perception of visibility.

There are a smaller number of stations where there is still a human observer to estimate visibility (e.g. at airfields). When people make the measurements, they are estimating the maximum distance away that they can see an object located near or on the ground. The object should be identifiable against the background. If the visibility varies with direction, the lowest value is reported.

A person with 20/20 vision who is about 5 feet tall can see a horizontal distance of about 3 miles along a flat ground surface. The human eye is more sensitive and can see a greater distance, but 3 miles is the point at which Earth’s curvature bends away. The instrument observations employ physics and are not concerned with Earth’s curvature.

We are all interested in horizontal visibility as it has major implications for transportation. The measurement is made at weather stations since visibility is dependent on current weather.

Horizontal visibility near the ground is one of the observations plotted on a station model. It is measured in fractions of a mile, unless there is an obstruction due to current weather conditions, such as fog, rain or smoke. If the visibility is above 10 miles, the values are either omitted from the map or listed at 10 miles.

Steve Ackerman and Jonathan Martin, professors in the UW-Madison department of atmospheric and oceanic sciences, are guests on WHA radio (970 AM) at 11:45 a.m. the last Monday of each month. Send them your questions at stevea@ssec.wisc.edu or jemarti1@wisc.edu.

Category: Meteorology

Comments Off on How is visibility distance evaluated for a weather map?