Rhythm of Food
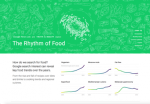
What can Google tell us about the way that individuals plan recipes throughout the year? During which month are people most likely to conduct a Google search for "eggplant"? This series of infographics, created by the Google News Lab in collaboration with data visualization company Truth & Beauty, are dedicated to the annual rhythms of how individuals think about food. This team has created a series of year clocks that show how the number of Google searches for a particular item ebb and flow throughout the year. Some trends are clearly impacted by holidays - unsurprisingly, searches for "champagne" generally peak around New Year's Day. Other trends are influenced by crop growing seasons. Of course, growing seasons vary around the world. Unless otherwise noted, all "year clocks" reflect data from the United States. One series of "year clocks," however, compare and contrast Google searches for three popular crops (kale, apple, and asparagus) in three different countries.
Archived Scout Publication URL
Scout Publication
Publisher
Classification
GEM Subject
Language
Date of Scout Publication
November 3rd, 2017
Resource URL Clicks
170
Resources


Comments