U.S. Census: Data Visualization
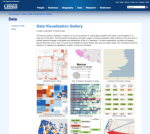
The U.S. Census Bureau has at its disposal a vast array of information for the general public. This online gallery provides access to several dozen visualizations documenting population change, settlement patterns, and more. First-time visitors might do well to look over the Migration Between California and Other States and the Center of Population, 1790-2010 visualizations as they are both quite compelling. The Population Bracketology visualization is a fun activity that asks people to test their knowledge of population data across the United States. Geography teachers can also use these visualizations to create conversation with their students on various demographic trends.
Archived Scout Publication URL
Scout Publication
Publisher
Classification
Language
Date of Scout Publication
January 24th, 2014
Resource URL Clicks
181
Internal
Cumulative Rating
0
Comments