Data Snapshots: Reusable Climate Maps
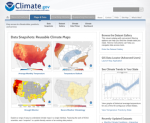
The National Oceanic and Atmospheric Administration's climate education site provides "timely and authoritative scientific data and information about climate" in order to "promote public understanding of climate science and climate-related events." While NOAA provides a wealth of information on its site, the Maps & Data section is unique for its visual representations of complex patterns. Here readers will find continually updated maps of the United States, including depictions of average monthly temperatures, temperature outlook, severe weather climatology, and a drought monitor. The color-coding makes interpretation relatively easy, while the explanations that accompany each map fill out the story of what is happening around the nation. Readers will also find four data-related sections (Data Snapshots, Dataset Gallery, Climate Data Primer, and Climate Dashboard), each of which explicates the interpretation of climate data from a different perspective.
Archived Scout Publication URL
Scout Publication
Classification
GEM Subject
Language
Date of Scout Publication
September 4th, 2015
Resource URL Clicks
300
Internal
Cumulative Rating
0
Comments