U.S. Census Bureau: Data Visualization Gallery
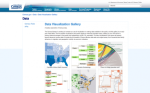
The U.S. Census Bureau works diligently to "portray historical changes in the growth and redistribution of the U.S. population." More recently, they have turned to graphics and visualizations to help accomplish this feat. On this website, readers will find the Census Bureau's latest efforts to use technology to visualize the multi-faceted and ever changing characteristics of the U.S. population. There are currently over 40 visualizations in the gallery that chart changes in demographics, housing, employment, and other topical areas. For instance, readers may view the historical acquisition of new territory as charted by evolving boundary lines, or explore the relationship between college majors and occupations. Of course, the site also offers many helpful links to other components of the U.S. Census Bureau's website that are worth further exploration.
Archived Scout Publication URL
Scout Publication
Publisher
Classification
GEM Subject
Language
Date of Scout Publication
September 23rd, 2016
Resource URL Clicks
239
Comments