An Interactive Visualization of Every Line in Hamilton
The musical Hamilton brought hip-hop to the forefront of conversations on using the genre as a teaching tool. This data visualization, last featured in the 10-19-18 issue of the Scout Report, further emphasizes connections between lyrics and learning.
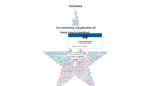
The visual essay "An Interactive Visualization of Every Line in Hamilton" was created by freelance software engineer Shirley Wu for the online magazine The Pudding. In her essay, Wu explores the relationships between the Broadway musical's characters, as well as themes that emerged when she examined patterns of lines repeated across songs, such as contentment and Eliza Schuyler's character development. As the reader scrolls slowly through the animated essay, Wu explains her motivation for creating this data visualization, as well as how the reader can explore the data themselves by filtering the color-coded data "by any combination of characters, conversations, or themes." She crafted this essay using a raw dataset that she created manually based on the musical's libretto, which she then visualized using D3.js and Canvas to create the mesmerizing animations seen here. Wu's essay is sure to appeal to fans of Hamilton or of data visualization in general. It should be noted that this essay is optimized for Chrome with a resolution higher than 1280x800, so mobile users may not have the best experience.
Archived Scout Publication URL
Scout Publication
Creator
Publisher
Classification
GEM Subject
Language
Date of Scout Publication
March 6th, 2020
Resource URL Clicks
515
Comments