As U.S. citizens prepare to go to the polls on November 8th, we've decided to dedicate our biannual special edition of The Scout Report to the topic of voting. While U.S. presidential elections date back to 1789, the practice of voting in such elections has greatly changed as suffrage rights have expanded and new forms of technology and media have emerged. We include in this edition resources that examine such changes alongside those that provide insight and information into contemporary practices of voting, both in the United States and around the world.
If you know of other great resources fitting this special edition theme, please let us know on our Facebook page (https://www.facebook.com/InternetScout ), by Tweeting @IntScout, or by emailing us at scout@scout.wisc.edu.
History of Voting in the United States
|
The Electoral College and Polling
|
Election Ephemera
|
Voting Around the World
|
History of Voting in the United States
Back to Top
|
 |
|
 |
|
History of U.S. Woman's Suffrage: Crusade for the Vote
|
Social studies |
|
The National Women's History Museum (NWHM) has created this impressive collection of primary source documents, lesson plans, and educational resources related to the long campaign to grant U.S. women full suffrage rights. Visitors can quickly and easily browse this collection by Primary Source Sets (organized into topics including The Early Republic, Abolitionist Movements, Women Suffrage in the West, and Imagery and Propaganda) or by Educational Resources (which includes videos that can be shown in the classroom and lesson plans). Alternatively, one can explore this collection through the History tab, which features a series of short essays and an Interactive Timeline to provide additional context. Primary Sources included in this collections include a number of speeches, powerful photographs, copies of the newspaper Woman's Journal and Suffrage News, cartoons, and more. [MMB] |
|


|
|
 |
|
 |
|
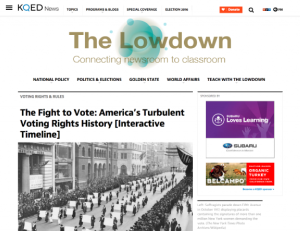
The Fight to Vote: America's Turbulent Voting Rights History
|
Social studies |
|
From KQED News comes this extensive interactive timeline, spanning 1787 to 2016, that highlights major events and laws impacting suffrage. For instance, in the first presidential election of 1789, as this timeline highlights, only 6% of the U.S. population was able to vote. Most events on the suffrage timeline highlight the passage of the 15th and 19th Amendments along with the Voting Rights Act, emphasizing woman's suffrage and the long movement for African-American voting rights. In contrast, this timeline includes important details about suffrages rights for other groups, providing a more thorough overview of U.S. Voting Rights. For example, included here is the legal exclusion of voting rights to Native Americans and Chinese Americans in 1876 and 1882, respectively. The timeline also highlights the 1952 McCarran-Walter Act, which provided citizenship and voting rights to first-generation Japanese- Americans. The comprehensive nature of this timeline makes it a useful K-12 classroom tool to start discussion or inspire individual research projects. The timeline is also accompanied by a lesson plan. [MMB] |
|


|
|
Election Ephemera
Back to Top
|
 |
|
Museum of the Moving Image: the Living Room Candidate
|
Social studies |
|
In 1952, Democratic Presidential nominee Adlai Stevenson was infamously photographed wearing shoes with a hole worn through the sole. Soon after, Stevenson supporters ran a televised commercial featuring a woman, clad in evening wear and pearls, singing, "I'd rather have a man with a hole in his shoes than a hole in everything he says!" The 1952 presidential election was the first to feature such televised campaign advertisements. Since then, the nature of these advertisements has changed greatly, but they continue to play an important role in U.S. presidential campaigns. On The Living Room Candidate, a website created by the Museum of the Moving Image, visitors can explore a number of these advertisements by election year. Visitors can also search this extensive collection (over 300 videos total) by Type of Commercial - a list that includes "backfire," "children," and "fear." While checking out these video clips, visitors can also get quick synopses of past candidates and view final Electoral College results. Educators can find accompanying lesson plans in the For Teachers section. [MMB] |
|


|
|
 |
|
 |
|
 |
|
U.S. Presidential Elections 1992-2012: Historical Photo Collection
|
Social studies |
|
Wisconsin Public Broadcasting Media Lab, using PBS Learning Media, provides this collection of 20 years of images related to US presidential elections. The site is optimized for teachers: captions list the permitted uses for each image, and grade levels are suggested. There's also a persistent link to browse by standards in order to find materials appropriate for different grade levels and standards such as Common Core (although this search goes beyond the Presidential Elections Collection, across the broader PBS Learning Media materials). For example, an image of Maya Angelou reading a poem at President Bill Clinton's inauguration can be streamed, downloaded, shared, modified, and is tagged as appropriate for grades 5 through 12. If a teacher creates a free account, it's possible to both create and save compilations of resources. [DS] |
|


|
|
Voting Around the World
Back to Top
|
 |
|
Pew Research Center: U.S. voter turnout trails behind most developed nations
|
Social studies |
|
In 2012, 53.6% of all Americans eligible to vote participated in the Presidential election, significantly fewer than the 87.2% of Belgians who participated in Belgium's most recent national election. What accounts for low voter turnout in the United States? This 2016 Pew Research Fact Tank feature compares voting and registration data from the thirty-five nations that are part of the Organization for Economic Co-operation and Development (OECD). In the accompanying write up, author Drew Desilver considers a variety of factors that impact voter turnout, including compulsory voting laws and registration processes. Notably, the United States has a significantly lower voter registration rate (approximately 71% of eligible citizens are registered to vote in the United States, compared to 91% of their Canadian and British counterparts and 99% of all citizens in Japan), which, in turn, plays a key role in low U.S. voter turnout. Why is voter registration so comparatively low in the United States? One possible factor is that voter registration is a strictly individual responsibility in the United States, while the government plays a more active role in registering voters in other countries. [MMB] |
|


|
|
 |
|
 |
|


