Theme: Sports Statistics
Back to Top
|
 |
|
The Rise of Hyphenated Last Names in Pro Sports
|
Social studies |
|
You may have the jersey of a favorite athlete hanging in their closet, but have you ever thought about the significance of the name on the back? Jan Diehm, a self-proclaimed sports enthusiast and writer for The Pudding, has. "The Rise of Hyphenated Last Names in Sports" uses data from various sports reference sites to track the frequency of hyphenated last names in several different leagues (including the WNBA, NBA, and NHL) from the 1950s through the 2010s. The findings are creatively cataloged in an interactive chart that allows readers to select a sports league (using the dropdown bar on the left-hand side) and decade (using the sliding bar on the right-hand side). From there, the chart lists all the applicable players' jersey names, highlighting hyphenated names in yellow. For example, a search for NBA jerseys in the 1980s reveals only 1 of the 628 players used a hyphenated last name (that player is the legendary Kareem Abdul-Jabbar). Nonetheless, "double-barrelled last names," are on the rise, and in the 2010s, 17 out of 782 NBA players chose hyphenated last names. In addition to colorful charts summarizing research findings, the piece shares some stories and illustrations (drawn by Arthur Mount). For example, Herb Mul-Key, the first NFL player to hyphenate his last name, did so because he was teased about his given "Mulkey," while football player BenJarvus Green-Ellis's hyphenation is an ode to his parents (combining their surnames). [EMB] |
|


|
|
 |
|
 |
|
Hot Takedown
|
Mathematics |
|
Produced by news outlet FiveThirtyEight, Hot Takedown is a podcast "where the hot takes of the sports world meet the numbers that prove them right or tear them down." While the show caters to sports enthusiasts, its content and tone invite all listeners to learn and laugh. The show is co-hosted by Sara Ziegler (FiveThirtyEight's sports editor), Neil Paine (a senior writer), and Geoff Foster (former sports editor). Together, the witty trio examines sports teams, players, and topics through a statistical lens, offering insights on everything from NFL Draft Day (see the April 28, 2020 episode) to coping with a basketball-less spring (see the March 31, 2020 episode). FiveThirtyEight first introduced the podcast in 2015, though it took a hiatus in 2018. In 2019, the show was "reborn," releasing new hour-long episodes every week. You can find these episodes, along with show notes and some additional resources referenced in each episode, at the link above. The podcast is also available on popular streaming sites such as Spotify and Apple Podcasts. [EMB] |
|
|
|
 |
|
Harvard Sports Analysis Collective
|
Mathematics |
|
Launched in 2009, the Harvard College Sports Analysis Collective's (HSAC) blog is an extension of the student-run organization that was started three years prior. HSAC provides a space for "quantitative analysis of sports strategy and management," and the blog (written by Harvard University students and faculty) builds on this mission. Under the Topics tab, visitors can choose a sport or subject that suits their interests (such as MLB Baseball or Business). Readers with a more general interest may want to scroll through the homepage, where posts are featured by recency. For example, a recent piece, "HSAC'S 2020 NFL Mock Draft" (written by a group of contributors, including the organization's Co-Presidents Ella Papanek and Danny Blumenthal), discussed the group's predictions for the April 2020 event. Blog posts have gained traction far beyond Harvard's campus. In fact, some posts have been featured by national news outlets, including the Wall Street Journal and Yahoo! Sports. The Publications page catalogs all of these features, broken down by Papers and Articles and Videos. In addition to the blog's wealth of information, readers looking for more content relating to sports statistics and analysis are in luck. The Resources page links to several other databases, academic journals, and websites that may be of interest. [EMB] |
|
|
|
 |
|
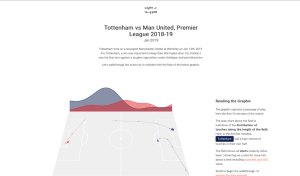
Tottenham vs Man United, Premier League 2018-19
|
Mathematics |
|
Some games are so legendary sports fans wish to relive them for years to come. "Tottenham vs Man United, Premier League 2018-19," allows soccer fans to do just that, with a statistical twist. The data visualization project memorializes the January 13, 2019 game between Tottenham and Manchester United soccer clubs with an in-depth analysis of each team's plays, shot attempts, and goals, broken down in timed increments. Shots are color-coded by team, and readers can hover over a shot to reveal additional details (including the "expected goal value" calculated using a variety of shot quality indicators). Readers can enjoy an automated "walkthrough" of the data by scrolling down the page or can choose to explore freely by skipping to the Explore Yourself option at the bottom of the page. Amsterdam-based engineer and designer Vignesh Shenoy created the piece for his blog Shape of the Game, "a collection of data-driven, interactive explorations." As of this write-up, only one other post is featured on his site, "Kohli's path to 10,000 ODI runs, charted," which dissects the cricketer's impressive career. [EMB] |
|
|
|